
This is the first article in a new series for those who want to peek under the hood of science. It’s for the curious, the question-askers, and the healthy skeptics. If you’ve ever wondered not just what is true in public health, but how we know it’s true—come geek out with us.
The Claim That Sparks Eyebrows
You’ve probably seen the headlines:
“COVID-19 vaccines saved millions of lives.”
That’s a bold claim. But if you’re even a little skeptical—good. Skepticism is what keeps science honest. The real question isn’t “is that true?”—it’s “how would we know if it is?”
This article digs into the math and modeling behind that claim: what scientists actually did to estimate those numbers, how they know it’s not just guesswork, and where the limits of that certainty lie.
The First Challenge: You Can’t See the Lives That Weren’t Lost
The problem with prevention is that success is invisible. No one throws a parade for the heart attack that didn’t happen, or the ICU bed that stayed empty.
So how do scientists estimate how many lives vaccines saved?
They use something called a counterfactual—a modeled version of what would have happened if vaccines had never been introduced.
That might sound like science fiction. But in public health, counterfactual modeling is the standard approach when running a real-world experiment would be unethical or impossible (you can’t exactly assign one half of the world to go without vaccines for a few years).
🧮 A Peek Under the Hood: How the Math Works
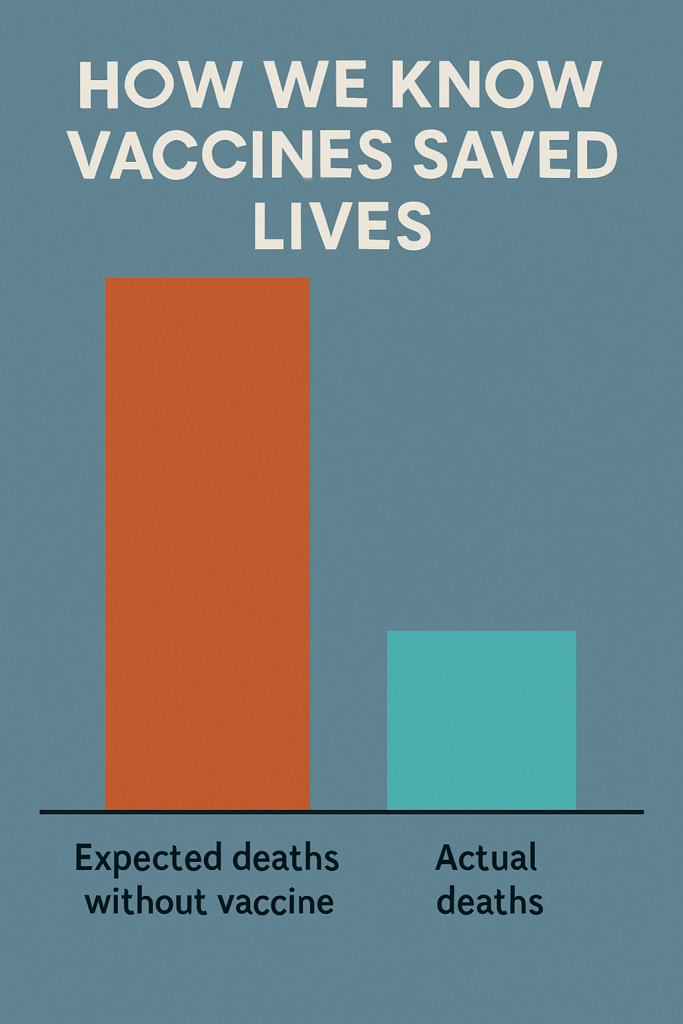
To estimate lives saved, researchers need two key numbers:
- How many people likely would have died without vaccines?
- How many people actually died?
The difference = estimated lives saved.
Let’s break down both sides of that equation.
📈 Estimating the “No-Vaccine World”
- Estimate how many people were infected
Not just confirmed cases—those were undercounted everywhere. Researchers use modeling based on hospitalizations, test positivity rates, and antibody studies to estimate the true number of infections. - Apply the infection fatality rate (IFR)
That’s the chance someone dies if infected. It varies by age:- For seniors: IFR might be 5–10%
- For middle-aged adults: ~0.5–1%
- For children: <0.01%
- Multiply infections × IFR
This gives the estimated deaths in a no-vaccine world. Example (simplified):
If 100 million people are infected, and the average IFR is 0.8%,
→ 100,000,000 × 0.008 = 800,000 deaths
This is how researchers modeled the alternate reality without vaccines—based on real data from before vaccines existed.
⚰️ Measuring the Actual Death Toll
Next, scientists look at how many people actually died.
But official COVID death counts are messy. Some deaths went unreported or misclassified—especially early in the pandemic.
So researchers turn to a better measure: excess mortality.
That means looking at how many more people died than expected, based on previous years. It captures both recorded and unrecorded COVID deaths—and even some indirect deaths, like from overwhelmed hospitals.
Example:
If a country usually sees 50,000 deaths/month, but saw 70,000 in January 2021,
→ That’s 20,000 excess deaths.
It’s not perfect—but it’s far more comprehensive than official case counts.
🧾 Real Numbers: What the Models Found
A widely cited study in The Lancet Infectious Diseases modeled what would have happened in each country if vaccines hadn’t been introduced.
They estimated that vaccines prevented between 14 million and 20 million deaths globally in the first year alone.
And it’s not just one study. Multiple research teams—using different assumptions and methods—landed in the same ballpark.
Example:
In India, the model estimated 4.2 million deaths would have occurred without vaccines.
The actual excess deaths were far lower—suggesting over 3 million lives were saved there alone.
🧪 “But Isn’t That Just a Model?”
Yes—and that’s not a flaw. It’s how science works when we can’t run randomized global experiments.
A good model is not a guess. It:
- Uses real-world data
- States its assumptions transparently
- Includes uncertainty estimates (like confidence intervals)
- Gets tested by other scientists
When different teams using different data still land in the same range—that’s a powerful sign the model is capturing something real.
🧠 What About “Statistical Significance”?
In clinical trials, we often hear that a result is statistically significant. But what does that mean?
It means the difference observed—say, between vaccinated and unvaccinated groups—is very unlikely to be due to chance.
Take the original Pfizer vaccine trial:
- 162 people in the placebo group got COVID
- Only 8 in the vaccinated group got COVID
- That’s an over 95% reduction
- Statistically, the odds of that happening by chance were less than 1 in 10,000
That’s not vague. That’s math.
In larger models, we use confidence intervals to express uncertainty. For example:
“Vaccines saved 14.4 million lives, with a 95% confidence interval of 13.7 to 15.9 million.”
That’s a way of saying: “We’re pretty sure it’s in this range. And even our lowest estimate is huge.”
🤔 But What If Excess Deaths Came From Lockdowns, Not COVID?
It’s a fair question. Excess deaths capture all causes—what if many were due to mental health, missed screenings, or economic effects?
Here’s why that’s unlikely to explain most of the numbers:
- The timing of excess deaths closely matches COVID waves
- In most countries, excess deaths fell sharply right after mass vaccination—even when restrictions were still in place
- COVID-positive hospitalizations and ICU admissions track closely with excess deaths
In short: we can’t rule out some non-COVID factors. But the overwhelming signal matches infection, not policy.
🧠 Why This Matters
We don’t expect you to believe these numbers just because a headline says so. But we do hope you’ll walk away understanding that:
- The math isn’t magic—but it’s rigorous
- Models aren’t perfect—but they’re based on real data
- And when multiple lines of evidence all point the same way, we’re not dealing with guesses—we’re dealing with confidence.
COVID vaccines weren’t flawless. But the data says they prevented an unimaginable amount of death and suffering.
And that’s not a political statement. It’s a mathematical one.
For Further Reading
- The Lancet Infectious Diseases: Global impact of the first year of COVID-19 vaccination
- Our World in Data: COVID-19 vaccine impact and coverage
- Johns Hopkins: How Vaccines Work
Last Updated on June 30, 2025


